|
Boddington, Hedges, Wandoo, Jarrah |
|
|
Western Australia, WA, Australia |
| Main commodities:
Au Cu
|
|
 |
|
|
 |
Super Porphyry Cu and Au

|
IOCG Deposits - 70 papers
|
All available as eBOOKS
Remaining HARD COPIES on
sale. No hard copy book more than AUD $44.00 (incl. GST) |
|
|
The Boddington gold-copper deposit is one of the largest gold producers in Australia. It is located 13 km WNW of the township of Boddington, and 95 km SE of Perth in Western Australia (#Location: 32° 44' 50"S, 116° 54' 19"E).
The deposit lies within the northern half of the small Saddleback greenstone belt in the South West Terrane of the Archaean Yilgarn craton. It also falls within the southern section of the Darling Plateau bauxite province that includes a cluster of large bauxite deposits, several of which overlie the Saddleback greenstone belt. Gold mineralisation has been exploited at Boddington in two major phases. The first was between 1986 and 2001, mainly from the bauxitic laterite and saprolitic profile, complemented by underground high grade, hard rock, lode ore from the Jarrah quartz veins. The second phase of mining commenced in 2009 and continues to the present, exploiting the large, hard-rock Wandoo deposit within the underlying greenstone basement.
The Saddleback greenstone belt was first recognised in 1976 (Wilde, 1976) during regional mapping by the Geological Survey of Western Australia (GSWA). A program of stream sediment and follow-up soil and rock sampling by the GSWA in 1978 over sections of the greenstone belt returned anomalous values of Au (up to 1.6 ppm), As, Cu, Pb, Mo and Zn (Davy, 1979). These results encouraged Reynolds Australia Mines Pty Ltd to undertake a program of surface laterite sampling for gold in 1980, and selected re-assaying of vacuum drill holes for gold from a bauxite program conducted over the area by Alwest Pty. Ltd. in 1977 and 1978. This resulted in the estimation of a resource of 15 Mt @ 2.77 g/t Au by 1981, followed from 1981 to 1984 by a 50 x 50 m program of reverse circulation core drilling to bedrock, outlining a pre-JORC recoverable reserve of ore and marginal ore of 45.1 Mt @ 1.80 g/t Au in 1984 (Symons et al., 1990).
Mining commenced in 1986 at a rate of 3 Mtpa, with the first gold pour in July (Collings and El Ansary, 1987). The bulk of the ore mined was in clay, which did not require blasting. Worsley Alumina Pty Ltd, who also operated the nearby Boddington Bauxite Mine, managed the Boddington Gold Mine on behalf of a joint venture between Reynolds Australia Alumina Ltd (40%), the Shell Company of Australia Ltd (30%), BHP Minerals Ltd (20%) and Kobe Alumina Associates (Australia) Pty Ltd (10%). By 1994, after a series of corporate divestments, amalgamations and asset sales, the partners were Normandy Poseidon (44.44%), Acacia Resources (33.33%) and Newcrest Mining (22.23%).
The Hedges Gold Mine exploited the northwestern section of the oxide deposit on the Alcoa of Australia bauxite mining leases from 1988 at a rate of 2 Mtpa, operating separately until purchased by the Boddington Gold Mine partners in 1998.
In 1990, the high grade Jarrah Quartz Veins were discovered and put into production through mining at the bottom of the laterite pit and as an underground decline operation, to recover 9.3 tonnes of gold between October 1992 and March 1997.
Mining was suspended on 30 November 2001 after the known oxide ore resource had been processed and ~189 tonnes of gold and 6500 tonnes of copper had been recovered from ~134 Mt of oxide and ~5 Mt of ‘hard rock’ ore from Hedges and Boddington (Newmont staff, pers. com. 2011). The lateritic orebody was mined by selective open cut methods over an area of 4.5 x 1 km. Gold was extracted by a carbon in leach processing, with an average metallurgical recovery of 95% (Symons et al., 1990).
Although the laterite resource had been depleted, the presence of low grade basement mineralisation had been known since the late 1980s, and a program to define and develop the hard rock Wandoo resource had been initiated in 1994 and was ongoing in 2001.
Newmont acquired Normandy Mining Limited in 2002, then the Newcrest share of the joint venture in 2006. AngloGold had merged with Acacia Resources in late 1999, and sold its Boddington interest to Newmont in 2009, who then became the sole owner of the operation. Testing over this period had progressively enlarged the resource, which by 31 December 2009, totalled a proved + probable reserve of 875 Mt @ 0.75 g/t Au, 0.11% Cu, for 650 tonnes of contained gold with an estimated metallurgical recovery of 82% (Newmont 2009 Reserves and Non-Reserve Mineralization report). Following a positive feasibility study, Newmont commenced the second phase of mining in 2009 as two major open pits over a length of 3.75 km within the earlier laterite pit, with the first gold poured in November of that year. The current (2019) mill capacity of the operation is 39 Mtpa. Remaining reserves and resources are outlined below.
Regional Setting
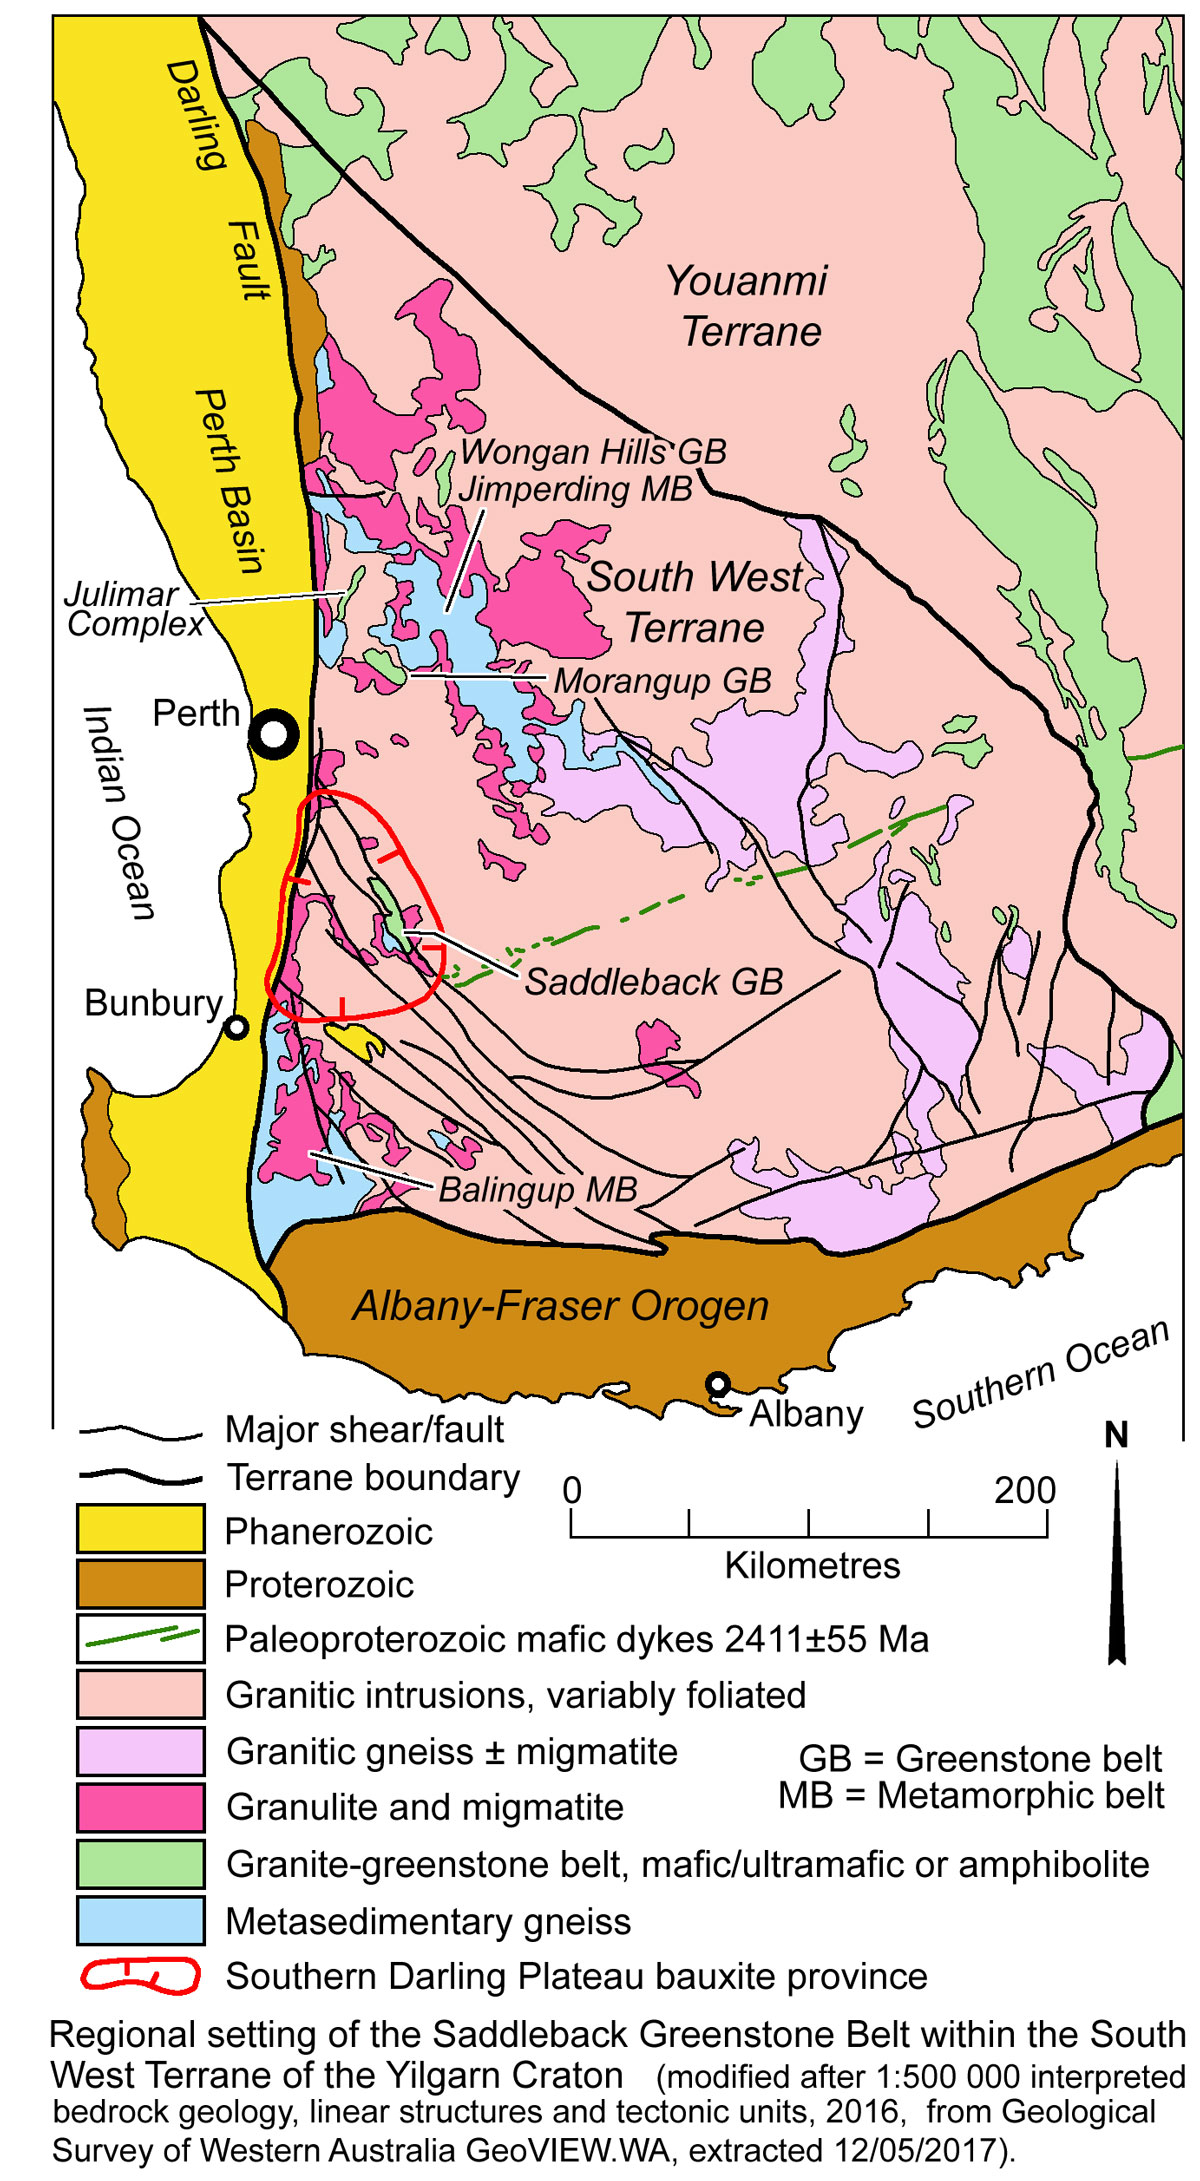
The Boddington Au-Cu mine and Saddleback greenstone belt are located within the Archaean South West terrane, which covers an area of ~100 000 km2, and was amalgamated with the adjacent Youanmi terrane at ~2.65 Ga (Cassidy et al., 2006). It is characterised by a paucity of preserved greenstone belts compared to adjacent terranes of the Yilgarn craton, and those that are known, are comparatively small.
The South West terrane is predominantly composed of granitic rocks, the majority of which are divided into five main overlapping suites based on geochemical characteristics, emplaced between 2.75 and 2.62 Ga with a volumetrically smaller group dated at 2.85 to 2.70 Ga (Qiu and McNaughton, 1999). The bulk of these granitic rocks are younger than 2.69 Ga, and mainly comprise monzogranite, granodiorite and alkali feldspar granites. The younger granitoids were emplaced between 2648 and 2626 Ma, with continued cooling and Pb loss from zircons, from 2628 to 2616 Ma. Post-tectonic, ~2580 Ma granitoids also occur towards the eastern margin of the terrane (Wilde et al., 1996; Nemchin and Pidgeon, 1997).
Extensive granulite facies metamorphism with associated migmatite and charnockitic granites were formed between ~2.64 and 2.62 Ga producing a series of high-grade metamorphic domains. The most significant are the Balingup and Jimperding metamorphic belts. An extensive, but irregular, corridor of granitic gneiss and migmatites, with associated small layered mafic intrusions, continues SE from the latter to the southern edge of the Yilgarn Craton. These metamorphic domains appear to be related to broad zones of shallow, west-vergent, thrusting (Wilde et al., 1996).
Supracrustal sequences are mainly represented by 3.2 to 2.8 Ga quartz-feldspar-biotite gneisses that are predominantly after siliciclastic and chemically-precipitated metasedimentary rocks protoliths and orthoquartzites (Cassidy et al., 2006). These sequences generally predate the granitoids and are mostly preserved within extensive zones of granulites, migmatites and granite gneisses, particularly within the cores of the Balingup and Jimperding metamorphic belts.
Preserved greenstone belts are limited in extent and number, and have a range of ages. In the west, the Wongan Hills greenstone belt to the north has been dated at ~3.01 to 2.82 Ga, similar to the metasedimentary gneisses, and comprises mafic and felsic volcanic rocks, chert, BIF and small ultramafic intrusions. The Morangup and Saddleback greenstone belts are younger, composed of basaltic, intermediate and lesser felsic volcanic rocks, ultramafic dykes and granitoids emplaced between 2714 and 2612 Ma. Both are partially fringed by granulites and older metasedimentary gneisses. The latter are interpreted to represent older sialic basement onto which the greenstone belt rocks have been emplaced. Both are otherwise truncated by younger granitoids (Wilde et al., 1996).
Saddleback Greenstone Belt
The main Saddleback greenstone belt (SGB) trends NNW-SSE over a strike length of 42 km. It is straddled by two major late shear zones, with a width that is generally ~6 km, but is up to 8.75 km in the southern half. Gravity data indicates that the vertical thickness of the belt increases from around 1 km in the vicinity of Boddington Gold Mine, to over 4 km in the south of the SGB. It is enclosed by younger granites in the northern section, but to the south has contacts with both older metasedimentary gneisses and with granulite gneisses and migmatites. Wilde (1976) observed both faulted and intrusive contacts defining the outer margin of the SGB.
Wilde (1976) divided the sequence within the SGB into three units. The first is the Hotham Formation, which is restricted to a 3 km2 triangular area on the south-eastern margin of the SGB, and is largely composed of meta-sedimentary rocks. The sequence comprises a suite of quartz-mica schist, meta-siltstone, meta-tuff and fine-grained meta-greywacke, followed to the east by the dominant meta-siltstones with a few thin bands of agglomerate, which in turn, passes conformably via a transitional boundary into the volcanic rocks of the Wells Formation.
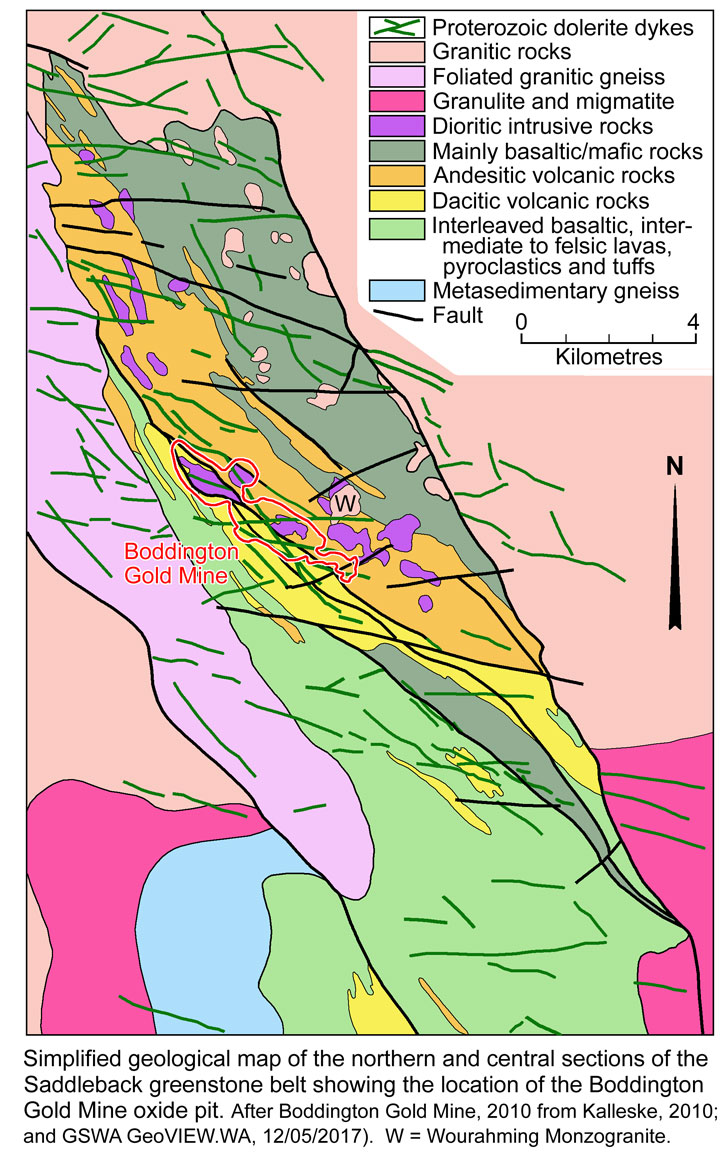
The Wells Formation, which is ~5500 m thick in the Boddington Gold Mine area, comprises interfingering andesitic, dacitic and rhyodacitic lavas, porphyritic lavas, tuffs, breccias, agglomerates and minor sedimentary rocks, all of which are variously deformed and metamorphosed. In general, lavas are more abundant in the north whilst pyroclastic rocks predominate in the southern half of the SGB. Relatively thick bands of dacite and andesite have been differentiated in mapping towards the northeast, hosting the ore deposit. This formation corresponds to the interleaved basaltic, intermediate to felsic, dacitic and andesitic volcanic lithofacies divisions shown on the accompanying image.
 The Marradong Formation is 3000 to 8000 m thick and dominated by meta-basaltic rocks with only minor dark metasedimentary intercalations and rare bands of more evolved volcanic lithologies. The contact with the Wells Formation is reasonably abrupt and conformable, although thin bands and lenses of meta-dacite occur within the western basaltic rocks close to the contact. Laterite cover of this formation is almost complete and as a consequence exposure is poor.
Within the northern SGB, the Wells and Marradong formations are cut by shallow granitoid plutons which include weakly to strongly porphyritic diorite and microdiorite, monzodiorite, quartz-diorite, granodiorite and tonalite, as well as ultramafic dykes and late monzogranite.
The Marradong Formation is 3000 to 8000 m thick and dominated by meta-basaltic rocks with only minor dark metasedimentary intercalations and rare bands of more evolved volcanic lithologies. The contact with the Wells Formation is reasonably abrupt and conformable, although thin bands and lenses of meta-dacite occur within the western basaltic rocks close to the contact. Laterite cover of this formation is almost complete and as a consequence exposure is poor.
Within the northern SGB, the Wells and Marradong formations are cut by shallow granitoid plutons which include weakly to strongly porphyritic diorite and microdiorite, monzodiorite, quartz-diorite, granodiorite and tonalite, as well as ultramafic dykes and late monzogranite.
According to Allibone et al. (1998), geologic mapping and radiometric dating in the Boddington Gold Mine area suggest the Wells and Marradong Formations, and associated intrusions, are the result of at least five discrete Archaean magmatic events, two of which are apparent within the Wells Formation, suggesting a temporal break within that sequence. These are as follows: (i) From ~2714 to 2696 Ma, indicated by intrusive monzodiorite to granodiorite dated at 2714±2 and 2696±4 Ma in the central Boddington Gold Mine, intruding host volcanic rocks of the Wells Formation, which must therefore fall within the same age range or be older; (ii) Between ~2696 and 2675 Ma, represented by a set of NNW trending peridotite-pyroxenite-dolerite to gabbroic dykes that may be up to a few tens of metres thick; (iii) At ~2675 Ma, when a second suite of intermediate to basaltic volcanic and volcaniclastic rocks were deposited to the north and east of the deposit, visually indistinguishable from the earlier suite, accompanied by coeval granodiorite-tonalite intrusions; (iv) Numerous pyroxenite dykes that cut rocks from all three previous events, but predate the fifth; (v) ~2612 Ma, represented by the un-mineralised Wourahming monzogranite to the northeast of the Boddington Gold Mine, cutting rocks associated with all previous events. This intrusion is distinct in terms of its texture, magnetic signature, radiometric signature and age.
All of these magmatic rocks are cut by at least three generations of Proterozoic dolerite dykes that are locally up to 80 m thick.
Wilde (1976) mapped the Marradong, Wells and Hotham formations as three time stratigraphic units younging to the NE. However, McCuaig et al. (2001) suggest the Marradong Formation is the oldest, temporally overlapping the Wells Formation, both formed during the ~2714 to 2696 Ma magmatic event, whilst the 2675 event also contributed to the Wells Formation, and the Hotham formation post-dates both.
Three generations of NNW to NW striking ductile shear zones are recognised in the Boddington Gold Mine area, each characterised by a distinct mineral assemblage and an incipient to strongly developed foliation, generally subparallel to the primary lithologic layering. D1 and D2 are both indicated to have northeast-side up, dominantly dip-slip displacement and are separated by the first pulse of ultramafic dykes, whilst D3 postdates the ~2675 Ma magmatic event. A fourth deformation D4, produced numerous narrow WSW oriented brittle faults that accompanied emplacement of the second generation of ultramafic dykes and cut all the rocks emplaced at or before -2675 Ma. This set of parallel, en echelon D4 faults are restricted to a kilometre-wide, generally NW-SE elongated rectangular zone in the core part of the Boddington Gold Mine. It also reactivated D1/D2 structures (Allibone et al., 1998).
Mineral assemblages within the SGB rocks indicate metamorphism to upper greenschist and lower amphibolite facies under relatively low-pressure conditions between 2650 and 2630 Ma, in contrast to the granulite facies of the enclosing older rocks framing the SGB in the south.
Regolith and Oxide Mineralisation
The regolith at the Boddington Gold Mine was developed by in situ weathering of Archaean bedrock, with only minor transport of the residuum. It is divided into upper laterite and lower saprolite zones that are 2 to 15 and 25 to 80 m thick respectively, separated by a 1 to 5 m thick transitional ferruginous clay zone. From the surface, the laterite zone comprises 1 to 10 m of topsoil and loose gravel, which includes nodules and pisoliths of hematite and maghemite. These are underlain by 1 to 2 m of ferruginous duricrust which forms an almost continuous blanket over large areas and may be either pisolitic or fragmental. The latter contains fragments from a few mm to >30 mm across in a matrix of gibbsite and goethite. The underlying B-zone forms the base of the laterite profile and comprises a yellow-brown gibbsitic bauxite with goethite, hematite and minor kaolinite. It varies from 1 to 10 but averages ~4 m in thickness, is locally mottled and contains patches of saprolite and incipient nodules.
The underlying saprolite is 25 to 80 m thick, and ranges from white to multi-coloured, mottled and ferruginous kaolinitic clays, frequently with preserved rock textures and less destructive and very varied weathering in contrast to the laterite zone. There is a relatively abrupt saprock transition over a few metres into bedrock. The saprock is characterised by green smectitic clays, with rock fragments and well preserved textures. This interval is characterised by its retention of essentially all alkali elements (Symons et al., 1990; Anand, 2005; Collings and El-Ansary, 1987).
Bauxite mineralisation is hosted by the lateritic gravels, duricrust and B-zone. A semi-continuous blanket of gold mineralisation within the duricrust, B-zone laterites and in the underlying ferruginous clay zone accounts for ~30% of the gold in the regolith. This blanket has relative homogeneity and apparent continuity over lateral distances of hundreds of metres. The overlying lateritic gravels contained only anomalous, but not economic, concentrations of gold, and were generally discarded as overburden (Symons et al., 1990). Within the laterite zone, gold occurs in intimate association with iron and aluminium hydroxides, and was precipitated at a redox front at or near the Tertiary water table, whilst gold is depleted from the upper duricrust, suggesting ongoing leaching. Gold occurs as discrete grains, usually from 1 to 10 µm in diameter, with a fineness of >990 (Symons et al., 1990).
The remaining 70% of the gold in the regolith is hosted within the saprolitic clay and saprock zones. In contrast to the laterite zone, gold in the saprolite clays is relatively inhomogenous and has poorer continuity. It occurs in primary quartz veins, in clays immediately adjacent to mineralised quartz veins, and in secondary, shallow dipping, goethitic horizons. The latter are interpreted to represent precipitation at paleo-water tables. However, clays with little or no quartz or ferruginisation may also be well mineralised (Symons et al., 1990). Symons et al. (1990) noted that, whilst concentrations of secondary gold in shallow dipping goethitic horizons are locally dominant, detailed sampling confirms that the distribution of gold within the clay zone essentially reflects a primary control. As such remobilization due to weathering is less marked than in the laterite zone. In the saprock zone, the distribution of gold mineralisation is closely related to primary basement mineralisation. Supergene gold-copper-silver mineralisation has also been recorded in the saprock zone, with a downward zoning of copper minerals from malachite through cuprite, native copper and chalcocite to primary sulphides, principally chalcopyrite (Symons et al., 1990).
Hard-rock Mineralisation
The bulk of the oxide mineralisation directly overlies a complex of stockwork veining and incipient hydrothermal alteration which covers an area of >25 km2 within the SGB, centered on the late, barren, ~2612 Ma, Wourahming monzogranite. The highest concentration of veining, which encloses the Wandoo deposit, is found to the west of this monzogranite. It occurs within a kilometre-wide package of sheared andesitic and dacitic volcanic and dioritic intrusive rocks focused on the exposed western cusp of a large composite diorite stock, the upper sections of which are sporadically exposed over an area of 15 km2. The core of the composite stock comprises medium-grained aphyric diorite intruded by variably quartz-feldspar porphyritic diorites, and then by a later-stage, blue-quartz ptygmatic-veined quartz diorite.
The Wandoo deposit comprises two main, NW-SE elongated resource shells that are ~2 x 1 and 2 x 0.7 to 1 km to the SE and NW respectively within the corridor of strong veining, separated by a 500 m wide gap. These shells are further divided into at least eight domains based on lithology and grade. Mineralisation is inhomogeneous, with localised concentrations of from >1 to 19 g/t Au in veins, lenses and stock-works. It is characterised by a reduced assemblage, with chalcopyrite and pyrrhotite the dominant sulphides, and minor pyrite, sphalerite, cubanite, cobaltite, arsenopyrite and pentlandite. Molybdenite is locally a major mineral throughout the deposit. There is a strong correlation of Cu, Au, Mo, Bi and W in the core of the mineralised system, with Pb, Zn and Ag enriched on the periphery (Kalleske, 2010).
McCuaig et al. (2001) recognised two stages of mineralisation at Boddington, supported by age dating of associated molybdenite by Stein et al. (2001). The earliest is associated with the pre-2696 Ma diorite intrusion, and is accompanied by extensive, pervasive silica-biotite-amphibole alteration, occurring as complex quartz +albite +molybdenite ±clinozoisite ±chalcopyrite ±gold veins variably deformed by D1 ductile shearing. Re-Os ages from molybdenite in these veins indicates a formation age of ~2700 Ma. Subsequently, a ductile D1/D2 event was accompanied by silica-sericite-pyrite alteration, whilst ductile D3 shear zones produced mylonite zones with silica-albite-epidote-pyrite alteration. This latter stage of the first event was accompanied by massive quartz veins in D2 shear zones.
McCuaig et al. (2001) observed the second and main stage of mineralisation post-dated D3 and all of the magmatic events, with the exception of the late 2612 Ma monzogranite, and accompanied the D4 brittle deformation. It has been divided into the following paragenesis: (i) complex quartz +albite +molybdenite ±muscovite ±biotite ±fluorite ±clinozoisite ±chalcopyrite veins, comprising the main late Mo stage; (ii) Clinozoisite-sulphide-quartz-biotite veining containing the bulk of the low-grade skarn altered Au-Cu mineralisation; (iii) Actinolite ±sulphide ±quartz, carbonate-chlorite-sulphide, and sulphide veins which constitutes the main high grade mineralisation. Re-Os dating of these mineral assemblages (Stein et al., 2001) return a weighted mean model age of 2615±9 Ma, broadly synchronous with the Wourahming monzogranite. The latter has associated clinozoisite alteration which is also closely associated with the Au-Cu mineralisation.
Based on the integration of available geochemical and geological datsets, McCuaig et al. (2001) concluded that the main controls on ore were, in increasing order of importance: (i) The late ductile-brittle NW and WNW striking, subvertical D3-D4 fault network; (ii) Intersection of this fault network with structurally competent lithologies; (iii) Intersection of late faults with early ductile D1/D2 quartz-sericite shear zones. (4) NE-striking faults which compartmentalise the deposit and offset favourable host rocks pre-mineralisation.
High grade vein accumulations also occur within, and external to, the Wandoo resource, such as the Jarrah veins on the northern extremity of the Boddington Gold Mine. This vein system was predominantly within andesitic and to a lesser degree, felsic tuffaceous fragmental rocks and dioritic intrusions, hosted by the Jarrah Shear, a 50 to 150 m wide zone of shearing and deformation of varying intensity and age. The shear contained folded, recrystallised, extensional quartz veins, crosscut by later, brecciated fault structures hosting gold and base metal sulphides.
The Wandoo deposit is interpreted as a structurally-controlled, intrusion-related, Au-Cu deposit, formed by two overprinting magmatic-hydrothermal systems. The first has ‘porphyry-like’ characteristics, associated with dioritic intrusion at ~2700 Ma, the other coeval with a barren post-tectonic granitoid at ~2612 Ma. Although gold is associated with both events, the main stage, particularly the high-grade mineralisation, appears synchronous with the latter (McCuaig et al., 2001).
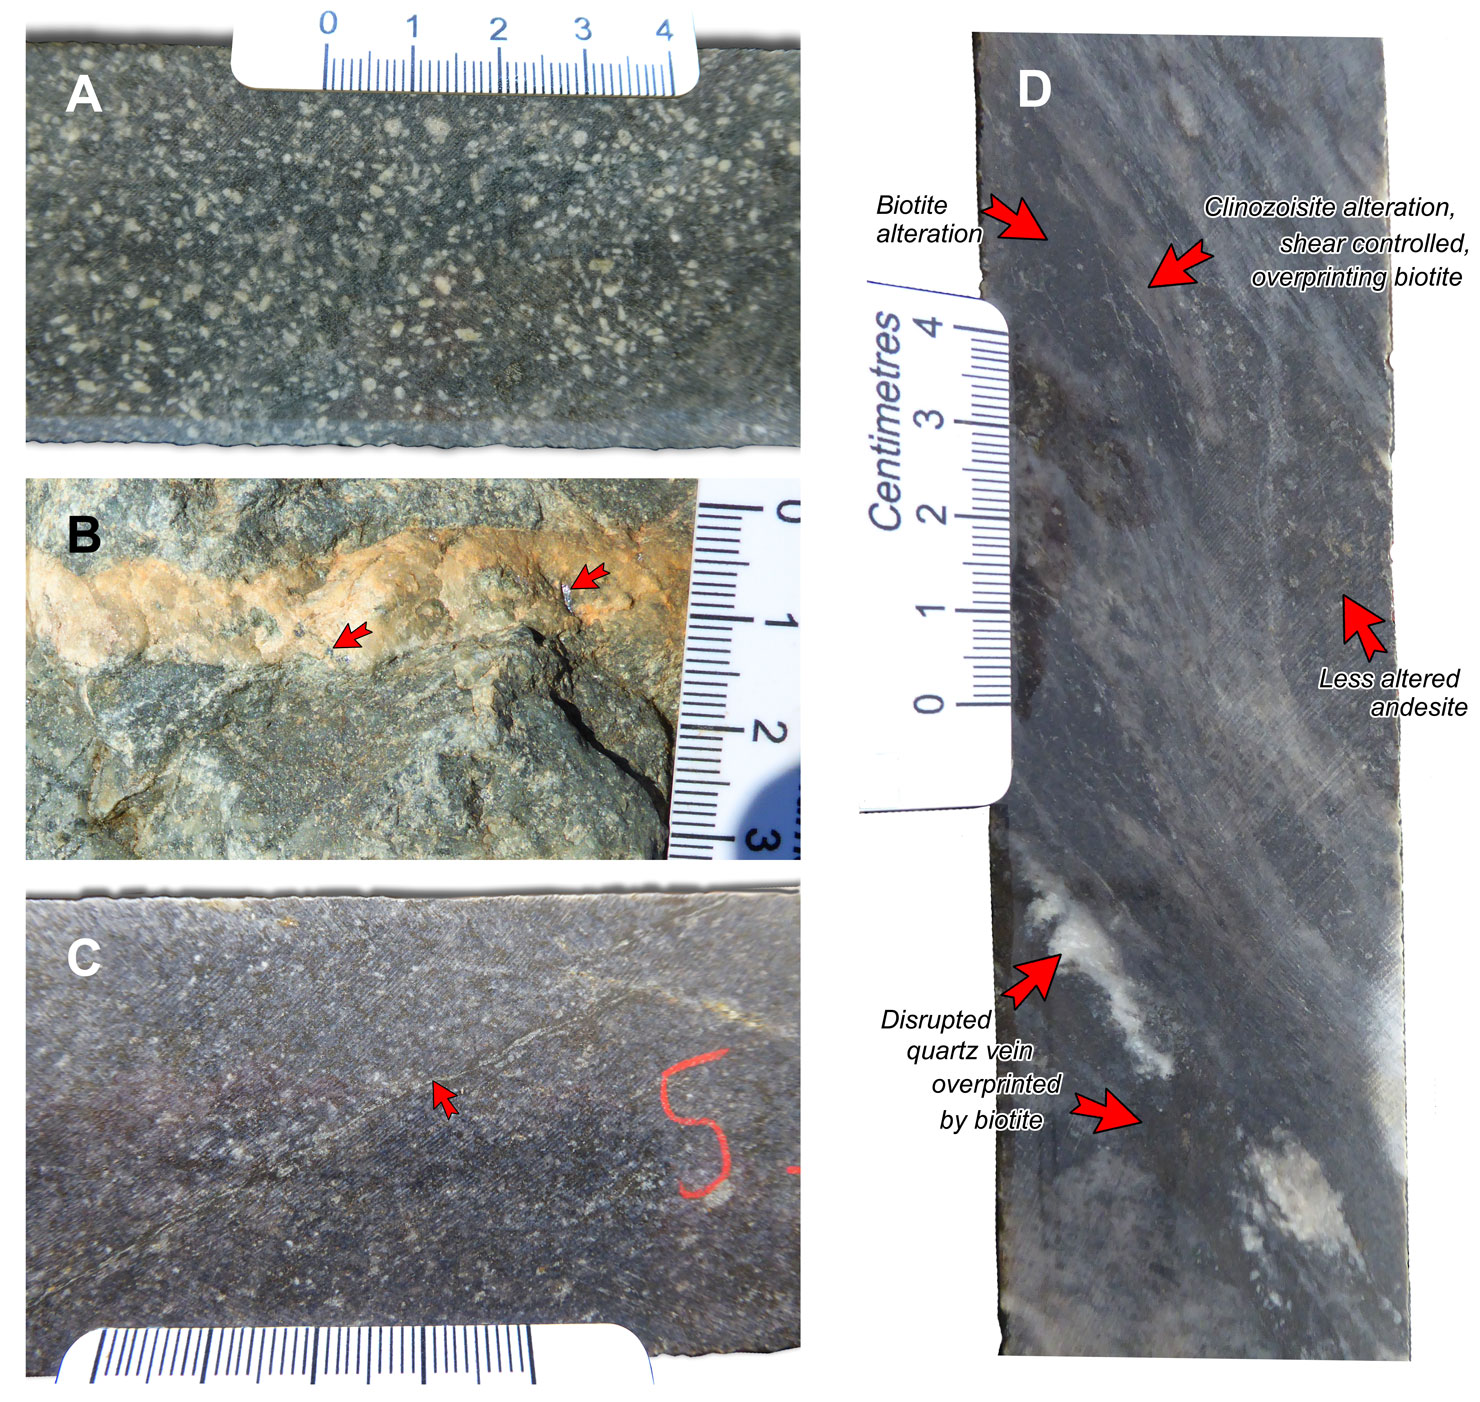
Selected lithologies and mineralised samples from the Boddington gold-copper deposit: A - weakly altered andesite wallrocks in drill core; B - a partially weathered sample of silica-biotite-amphibole altered diorite cut by an early quartz vein with molybdenite flakes (arrowed) from an ore stockpile sample; C - altered andesite in drill core, cut by thin gold bearing clinozoisite ±epidote veins (as arrowed) in an interval of >5 g/t Au; D - altered andesite within the ore zone containing disrupted early quartz veining that locally contains molybdenite, which is cut by dark biotite alteration. Biotite alteration is also seen to overprint more weakly altered andesite. The biotite alteration is overprinted by strong, pale grey clinozoisite alteration and veining that is controlled by late shearing. The main gold-copper alteration is associated with clinozoisite ±epidote alteration and veining. Clinozoisite and epidote are members of a solid solution series that ranges from [Ca2][Al3](Si2O7)(SiO4)O(OH) to [Ca2][Al2Fe3+](Si2O7)(SiO4)O(OH) respectively. Images by Mike Porter, 2019.
Reserves and Resources
The basement mineralisation in 2004 comprised (Newcrest Annual Report, 2005):
Proven + Probable Reserve - 395 Mt @ 0.87 g/t Au, 0.13% Cu; (reserves included in resources),
Measured + Indicated Resource - 505 Mt @ 0.86 g/t Au, 0.12% Cu, for 435 t Au;
Inferred Resource - 232 Mt @ 0.80 g/t Au, 0.09% Cu, for 185 t Au.
Following further drilling and development, the reserve and resources at 31 December 2009 (Newmont 2010) were:
Proven + Probable Reserve - 966.4 Mt @ 0.69 g/t Au, 0.11% Cu, for 664 t Au, (reserves additional to resources)
Measured + Indicated Resource - 364.8 Mt @ 0.44 g/t Au, 0.08% Cu, for 159 t Au,
Inferred Resource - 292.9 Mt @ 0.5 g/t Au, 0.11% Cu, for 146 t Au.
Remaining ore reserve and mineral resources at 31 December 2016 (Newmont 2017) were:
Proved Reserve - 205.4 Mt @ 0.76 g/t Au, 0.11% Cu, for 362 t Au,
Probable Reserve - 218.8 Mt @ 0.75 g/t Au, 0.11% Cu, for 362 t Au,
TOTAL Proven + Probable Reserve - 424.2 Mt @ 0.76 g/t Au, 0.11% Cu, for 322.4 t Au, (reserves additional to resources)
Measured Resource - 108.7 Mt @ 0.48 g/t Au, 0.11% Cu,
Indicated Resource - 245.5 Mt @ 0.53 g/t Au, 0.10% Cu,
Measured + Indicated Resource - 354.2 Mt @ 0.51 g/t Au, 0.11% Cu, for 181 t Au,
Inferred Resource - 7.5 Mt @ 0.58 g/t Au, 0.11% Cu, for 4.35 t Au.
TOTAL Resource - 361.7 Mt @ 0.76 g/t Au, 0.11% Cu, for 275 t Au.
The most recent source geological information used to prepare this decription was dated: 2010.
Record last updated: 1/9/2019
This description is a summary from published sources, the chief of which are listed below.
© Copyright Porter GeoConsultancy Pty Ltd. Unauthorised copying, reproduction, storage or dissemination prohibited.
Wandoo
|
|
|
Selected References:
|
Allibane A H, Windh J, Etheridge M A, Burton D, Anderson G, Edwards P W, Miller A, Graves C, Fanning C M, Wysoczanki 1998 - Timing relationships and structural controls on the location of Au-Cu mineralization at the Boddington Gold mine, Western Australia: in Econ. Geol. v93 pp 245-270
|
Anand R R, Butt C R M 1998 - Approaches to Geochemical Exploration in Lateritic and Related Terrains: a Comparison of Australian and African Terrains: in Africa: Geology & Mineral Exploration AIG Bull. AIG Bull. 25 pp 17-34
|
Anand, R.R., 2005 - Boddington gold deposit, Western Australia: in crcleme.org.au/RegExpOre/Boddington.pdf
|
Anonymous 1995 - Worsley Alumina Pty Ltd - Boddington Gold Mine: in Mine handout 11p
|
Anonymous 1998 - Normandy Mining Limited: in Extracts from the Normandy Mining Limited 1997 Annual Report pp 12-14, 17, 26-28.
|
Anonymous 1998 - Boddington: in Register of Australian Mining 1997/98 pp 77-78
|
Collings, P.S. and El-Ansary, M., 1987 - Feasibility Study Estimation of in-situ Resources and Recoverable Ore Reserves for the Boddington Gold Mine: in The AuslMM Sydney Branch, Resources and Reserves Symposium, November 1987, pp. 93-97.
|
Kalleske, N., 2010 - Mineralogical and petrogenic study of gold ore from the Boddington Gold Deposit, W.A.: in School of Earth and Environmental Sciences, University of Adelaide, BSc Honours Thesis, 83p.
|
McCuaig, T.C., Behn, M., Stein, H., Hagemann, S.G., McNaughton, N.J., Cassidy, K.F., Champion, D. and Wyborn, L., 2001 - The Boddington gold mine: A new style of Archaean Au-Cu deposit: in Cassidy, K.F., Dunphy, J.M. and Van Kranendonk, M.J., 2001 4th International Archaean Symposium, Extended Abstracts AGSO/Geoscience Australia Record 2001/37 pp. 453-455
|
Morriss P 1993 - Gold Ore Mining at Boddington Gold Mine, Boddington: in Woodcock J T, Hamilton J K (Eds), The Sir Maurice Mawby Memorial Volume AusIMM, Melbourne Mono 19, v2 pp 814-819
|
Porter, T.M., 2017 - Boddington-Wandoo gold-copper deposit: in Phillips, G.N., (Ed.), 2017 Australian Ore Deposits, The Australasian Institute of Mining and Metallurgy, Mono 32, pp. 287-290.
|
Stein, H.J., Markey, R.J., Morgan, J.W., Selby, D., Creaser, R.A., McCuaig, T.C. and Behn, M., 2001 - Re-Os Dating of Boddington Molybdenite, SW Yilgarn: Two Au Mineralization Events: in Cassidy, K.F., Dunphy, J.M. and Van Kranendonk, M.J., 2001 4th International Archaean Symposium, Extended Abstracts AGSO/Geoscience Australia Record 2001/37 pp, 469-471.
|
Symons P M, Anderson G, Beard T J, Hamilton L M, Reynolds G D, Robinson J M, Staley R W, Thompson C M 1990 - Boddington Gold deposit: in Hughes F E (Ed.), 1990 Geology of the Mineral Deposits of Australia & Papua New Guinea The AusIMM, Melbourne Mono 14, v1 pp 165-169
|
|
Porter GeoConsultancy Pty Ltd (PorterGeo) provides access to this database at no charge. It is largely based on scientific papers and reports in the public domain, and was current when the sources consulted were published. While PorterGeo endeavour to ensure the information was accurate at the time of compilation and subsequent updating, PorterGeo, its employees and servants: i). do not warrant, or make any representation regarding the use, or results of the use of the information contained herein as to its correctness, accuracy, currency, or otherwise; and ii). expressly disclaim all liability or responsibility to any person using the information or conclusions contained herein.
|
Top | Search Again | PGC Home | Terms & Conditions
|
|