|
Charters Towers Goldfield |
|
|
Queensland, Qld, Australia |
| Main commodities:
Au
|
|
 |
|
|
 |
Super Porphyry Cu and Au

|
IOCG Deposits - 70 papers
|
All papers now Open Access.
Available as Full Text for direct download or on request. |
|
|
The Charters Towers Goldfield lies some 1100 km NNW of Brisbane and 100 km SW of Townsville in north Queensland, Australia. To 1987, it was the third largest gold producer in Australia with a total cumulative output of 211 t Au at an average grade of 34 g/t Au (#Location: 20° 4' 54"S, 146° 16' 31"E).
The gold field was discovered in 1871 and sustained a production rate of over 6 tonnes (200 000 ounces) of gold per year for 15 years from 1892 to 1906, peaking at 9.95 tonnes of gold in 1899. The main operating mines were closed by 1918. Between 1872 to 1920, the goldfield produced some 205 tonnes of gold from 6 million tonnes of ore mined by up to 40 separates companies working individual mining leases on sections of the same reefs. There were 206 mining leases and 127 mines working 80 lines of reef and 95 mills, cyaniding and chlorination plants.
Following the cessation of production in the 1920s, and prior to 1980, exploration and stratigraphic drilling was undertaken by Towers Drilling Co (1932), and the Queensland Department of Mines in 1923 and 1969-70. A detailed project evaluation was conducted by Gold Mines of Australia (acquired by Western Mining Corporation Ltd in September 1957) in 1934-35, but no further work was undertaken.
The goldfield remained inactive from the 1920s until Charters Towers Gold Mines listed on ASX in December 1993 and set about designing and excavating the Brilliant East Decline (subsequently renamed the Central Decline) in 1994. Drilling and trial underground mining commenced in 1995 and in 1996 a gold processing plant was acquired and installed 10 km south of Charters Towers. Stripping of overburden commenced at Stockholm, 8 km SW of the Central Portal, in January 1996 for the commencement of trial open pit mining. Total gold production in trial underground and open pit mining from 1997 to 2000 exceeded 1.2 tonnes. Drilling during this period had resulted in a Total Mineral Resources in 1999 of 2 Mt @ 4.8 g/t Au containing 9.33 t of gold. During 2000, four key Mining Leases in the centre of the project were acquired from the Normandy Mt Leyshon Mining group. With these, the total Mineral Resource was increased to 2.7 Mt @ 9.6 g/t Au, containing 26.4 tonnes of gold. With further drilling, by 2001, the Total Mineral Resource had increased to 3.3 Mt @ 9.4 g/t Au, containing over 31 tonnes of gold, and the Brilliant Gold Reef Project Prospectus (Brilliant Mine) was issued. Deep drilling on the Brilliant Reef continued from 2002 to 2005, while two additional leases were acquired, giving control of all of the central goldfield mineral holdings.
During the period from 1995 to 2005, the trial mining program had involved five underground and two open pit operations, at the Central Decline, No.2 Cross Reef, Stockholm, Washington and Warrior mines, and new underground workings driven on extensions of known reef systems at Warrior, Stockholm, Washington and the No.2 Cross Reef. In addition, the historical workings on the Brilliant, Victory, Victoria and Washington reefs were re-opened and entered. The open pit mining was conducted on the Washington and Stockholm reef systems in from 1998 to 2000. These workings are distributed over an area of an east-west elongate area of >15 km2.
In 2005, an Inferred Mineral Resources was estimated to 1200 m depth, of 23 Mt @ 14 g/t Au, containing ~310 tonnes of gold. In May 2012, additional ore was added to to the Resource, with the following Ore Reserves and Mineral Resources published:
• Probable Ore Reserve at a 4 g/t Au grade cut-off - 2.50 Mt @ 7.7 g/t Au, 5.1 g/t Ag, containing 19 t of gold and 13 t of silver.
• Indicated Mineral Resource - 3.20 Mt @ 7.6 g/t Au, 5.1 g/t Ag, containing 24 t of gold and 16 t of silver.
• Inferred Mineral Resource at a 3 g/t Au grade over a minimum sample true width of one metre cut-off - 25 Mt @ 14 g/t Au, 9 g/t Ag, containing 350 t of gold and 220 t of silver.
NOTE: Resources are inclusive of Reserves.
Mining re-commenced in 2006, as the second stage of the trial mining operation. This involved the driving of an access decline at the Imperial Mine into the Warrior orebody, about 5 km SE of the centre of Charters Towers, 3 km south of the Central Decline and 6.5 km east of the Stockholm pit. The first gold from Warrior was poured in November 2006. Active operations continued until 2916 when the operation was put on care and maintenance pending raising sufficient capital to re-enter full gold production. Production between the commencement of trial mining in 2006 and the closure in 2016 totalled 3.25 tonnes of gold, including 1.18 t during the trial mining period. Processing plant recoveries have consistently been ~97% throughout the trial main production.
The two part trial mining between 1994 and 2016 was accompanied by >350 000 m of drilling in 3200 holes on down-dip and strike extensions of known reef systems, with 1600 significant drill intersections. This work has allowed the establishment of a robust geological model that has been predicted and then tested by diamond-core drilling to 2000 m vertical depth. This trial mining, the associated processing, and the reconciliation of predicted against actual production was aimed at gaining sufficient knowledge and experience to quantify confidence to an acceptable level of commercial risk for the project. It also yielded revenue from the sale of the >3 tonnes of gold recovered. This work also included examining the drill intersections and historic workings in three dimensions to establishing the payability and bulk grade of the various reefs, necessary to the calculation of resources and reserves in a reef system where the gold distribution is erratic and non-uniform. At Charters Tower, it is common for the poorly mineralised zones of a fissures to pass rapidly along strike into high-grade ore, and vice versa, and hence individual drill intersection may not be representative of the surrounding reef.
Payability is the aerial percentage occupied by mined stopes from historical records, compared to the total area of the host structure, as defined by the extent of exploratory drives within that same reef. The payability of the reefs that were historically mined between 1871 and 1920 was found to be ~30%, although those payable shoots had an average grade of 38 g/t Au. The highest payability obtained was 51.8% on the Brilliant structure. Because of the variability of gold values, a 30% payability for 38 g/t Au average ore shoot grade, means there is a 70% statistical probability that a random hole drilled into a reef will intersect a <38 g/t part of that reef, rather than the payable ore shoot. These 38 g/t Au payable shoots that were historically mined had an average width of 0.7 m, which therefore represents a ~27 metre-grams per tonne Au cutoff. Given the current resource has a 3 g/t Au and 1 m cut-off, i.e., 3 metre-grams per tonne, it is likely the payability will be >30%, although the conservative 30% figure has been utilised in the 2020 Mineral Resource Estimate, i.e., the total area of each reef was calculated from drilling and historic development, assumed to be 1 m thick, and multiplied by the SG to calculate a tonnage. This total reef tonnage was then multiplied by the payability factor of 30%, to give the Inferred Mineral Resource tonnage.
Grade continuity from historical mining records was found to vary from ~200 to 500 m along strike, and up to 1000 m down the plunge of individual shoots. These payabilities, as detailed above, and grade continuity distances were confirmed during trial mining at the Imperial mine area on the Warrior structure. In calculating the Inferred Mineral Resource, the included reefs were extended 50 to 100m beyond the boundary drill holes, depending on the drill density and confidence levels in the structure.
Grade estimation - because of the variability of grade distribution, an average grade was estimated for all Inferred Mineral Resources. This was based on a lower cut-off of 3 metre-grams per tonne Au, to include all significant drill intersections within extensions to the ore shoots, or mineable patches within barren areas. The average of the 112 significant drill intersections above 3 metre-grams per tonne is 13.5 metre-grams per tonne Au. So, as the minimum orebody width used is one metre, the grade is also 13.5 grams per tonne Au. This latter figure has been applied to the Inferred Resources, although there is no evidence that these extensions of known shoots and reefs would not average close to the previously-mined grades of 38 grams per tonne Au over 0.7 m in situ or 27 metre-grams per tonne diluted. Trial mining of the Imperial area reefs indicates that the mineralisation is identical to, and the grades are similar to, the historical values.
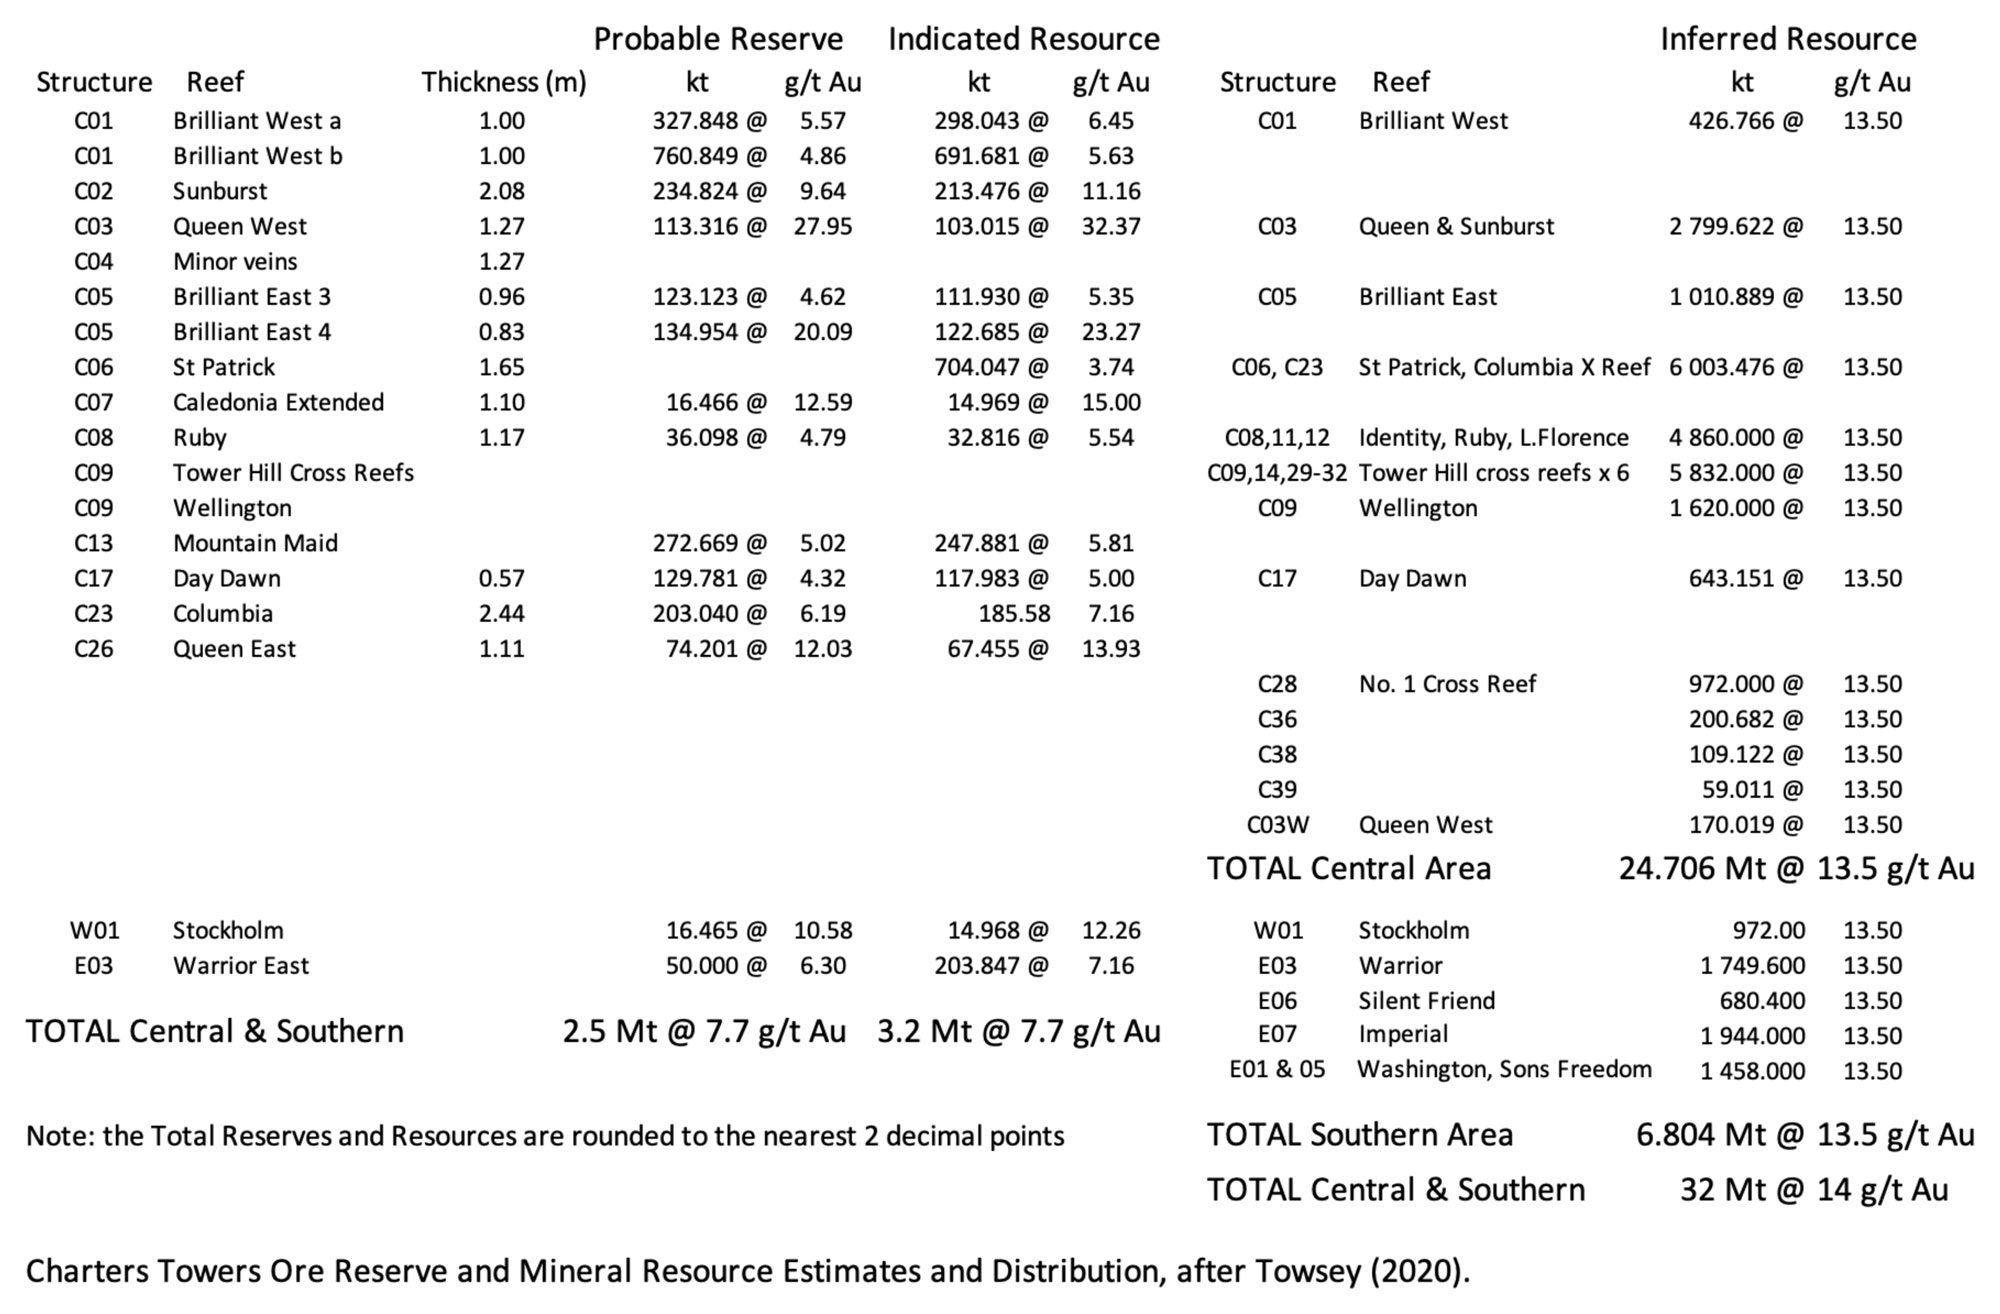
The grades of the Ore Reserves and Indicated Resources, which are more closely drilled and sampled, are based on the actual intersections in each reef, as reflected by the values quoted on the table below.
An updated JORC and NI 43-101 compliant quantification of the gold Resources and Reserves of the Charters Towers Gold Project was published as a Technical Report dated 8 December, 2020 (Towsey, 2020). The Reserves and Resources, which are the most recent, were calculated as detailed above, and were as follows:
• Probable Ore Reserve at a 4 g/t Au grade cut-off - 2.50 Mt @ 7.7 g/t Au, containing 19 t of gold.
• Indicated Mineral Resource - 3.20 Mt @ 7.7 g/t Au, containing 24 t of gold.
• Inferred Mineral Resource (cut-off - 3 g/t Au over a minimum true width of one metre) - 32 Mt @ 14 g/t Au, containing 435 t of gold.
NOTE: Resources are inclusive of Reserves. See the table below for a breakdown by reef and structure.
The surface projection of the Central Cluster of reefs (C01 to C32) form a SW-NE aligned zone of overlapping reefs with cumulative dimensions of ~7.5 x 2 km. A second line of three separated resources, C08 Ruby, C12 Identity and C11 Lady Florence, are aligned WSW-ESE to the south, partially overlapping the first group to the SW, and diverging to the east. The Central Decline is at the centre of this combined cluster. The Stockholm open pit W01, is 8 km SW of the Central Decline portal, whilst the, 3.5 km long, NNE elongated Imperial Cluster E01 to E07, including Imperial, Warrior, Silent Friend and Sons of Freedom are served by a decline from the bottom of the Washington open pit, 3 km south of the Central Decline portal.
Geology and Mineralisation
The Charters Towers Goldfield lies within the older, Ordovician age, Towers Hill Granodiorite phases of the 60 km2, 455-385 Ma Ravenswood Batholith. The auriferous lodes are cut by Carboniferous dykes and are absent from the adjacent Middle Devonian sedimentary rocks. Host units within the Batholith are the Towers Hill Granite/Granodiorite, the Hogsflesh Creek Granodiorite, the Alabama Diorite and the Millchester Creek Tonalite of Ordovician and Devonian ages. Minor mineralisation also occurs in the Neoproterozoic Charters Towers Metamorphics. Mineralisation at the Charters Towers and the Rishton-Hadleigh Castle mines was isotope dated, and proved to be the same age within an indistinguishable range, indicating emplacement of the auriferous reefs were essentially synchronous at 404 to 408 Ma in the Late Silurian to Early Devonian, and spread across a significant segment of the Ravenswood Batholith host (Kreuzer 2003).
The goldfield is part of a major 60 km long, east-west trending mineralised sytem composed of multiple lode zones. It lies along the Mosgardies Shear Zone and is believed to be related to the 400 Ma Lolworth Igneous Complex or the related thermal metamorphic event. Mineralisation is interpretted to be localised in a structural trap zone representing an extensional roof above a non-exposed granitic intrusive of the Lolworth Complex which subsequently underwent cooling and shrinkage. Mineralisation is believed to have been derived from fluids involved in deep late metamorphism, rather than from magmatic or metamorphic events higher in the crust.
There are some 80 major reefs in and around Charters Towers, of which 22 are included in the 2020 resource estimate. The main reef systems strike east-west and include the Brilliant, Day Dawn, Mexican, Queen and Sunburst lode zones, which extend over a strike length of five kilometres and are cut by NNW trending cross veins. A second east-west system, 800 m to the south, comprises the Golden Sunrise, Mary and Clark's Moonstone line of reefs, while a third system 500 m further south, includes the Ruby and Gladstone line of reefs. The most productive ore-bearing lodes (the Day Dawn, Brilliant and Queen) dip to the north beneath the city of Charters Towers.
The majority of the historic production was concentrated within a set of fractures extending over a 5 km long east-west strike length, and 500 to 1600 m down dip interval in a north-south direction. The mineralised lodes lie in two predominant directions, namely east-west, dipping at moderate to shallow angles to the north (the main production), and the NNW cross-veins which dip ENE. The east-west and NNW trends evident on a regional scale, are repeated on a local scale. East-west major reefs, such as the Day Dawn and Mexican structures dip more steeply at ~50°, whilst the NNE trending cross-reefs, such as the Brilliant workings dip at a shallower ~35°. A 2000 m hole drilled through nine structures passed through the C6 - St Patrick (559 m), the C5 - Brilliant (1320 m), the C3 - Queen West (1583 m) and six other structures in between.
The mineralised reefs are typically 0.3 to 1.5 m, locally up to 6 m thick, and in isolated cases up to 15 m. The average width has been estimated to have been less than 0.9 m over the majority of the field. Displacements on the mineralised fissures are mostly from 1 to 12 m.
The mineralised veins are both simple and composite hydrothermal quartz-gold systems with a gangue comprising 10% sulphides (in decreasing order of abundance - pyrite, galena, sphalerite, chalcopyrite and arsenopyrite, with traces of tetrahedrite and tellurides), carbonate, chlorite, gypsum, barite and clays, and locally containing crushed granodiorite. They are flanked by extensive sheet-like alteration zones comprising green muscovite and ankerite selvages, which pass laterally into propylitic (montmorillonite-illite) alteration.
Charters Towers gold is typically associated with galena and sphalerite in the pyritic sections of the quartz reefs and with associated shearing. Significant gold is not normally present in the disseminated pyrite which occurs in the proximal zone sericitic alteration. There is a relatively consistent and simple paragenesis over the entire region, commencing with the deposition of white quartz. The early quartz was subsequently fractured, and grey silica and pyrite deposited. Further refracturing was accompanied by the deposition, principally within the pyrite, of galena, gold, sphalerite ±quartz, and trace chalcopyrite. Late carbonate was the final phase of the main mineralising event. In places however, the mineralised fissures were reactivated and carbonate, carbonate/laumontite and other assemblages deposited. The economic gold is restricted to the quartz reefs (particularly within pyrite) and associated shearing. Significant gold is not normally present in disseminated pyrite within the adjacent sericitic alteration.
Ore shoots within the fissure system occur with a periodicity typically of the order of 120 to 300 m within the lodes, and have dimensions of mostly 200 to 700 m in the down plunge direction, and 70 to 300 m normal to the plunge direction. Gold mineralised reefs have been shown to persist to at least 1300 m depth vertically, and remain open at depth below that. A deep drill hole in 2008 demonstrated continuation of mineralised structures to at least 1900 m on the eastern side of the goldfield. The structural control of the Charters Towers ore shoots is variable. Some reefs thicken and thin over short distances with no obvious controlling feature. There is also no consistent enrichment or thickening where the east-west trending lodes and the NNW trending cross veins intersect.
The ore shoots are predominantly hosted by the sulphidic sections of the fissures, mostly comprising sheet-like masses sub-parallel to, and within the quartz reefs, but may occur as disseminations and irregular concentrations within the quartz. The continuity of the pyrite bodies is considerably less than that of the quartz reefs. Although usually coarse-grained, fine-grained sulphides are locally present in some shear zones.
The heterogeneous distribution of sulphides within the quartz, and the often erratic nature of the gold concentrations within the pyrite, result in a spotty distribution of ore grades and a high to extreme nugget effect. It is not uncommon for poorly mineralised zones of the fissures to pass rapidly along strike into high-grade ore, and vice versa. The ore is locally very rich, with several ore shoots known to average over 60 g/t Au (e.g. in the New Queen Cross, Talisman and parts of the Brilliant lode). The structural control of ore shoots is subtle, often at changes of dip and strike, with some reefs thickening and thinning over short distances with no obvious controlling feature. Shallow plunging, non-outcropping ore shoots are common. Typical examples of this are the Day Dawn and Brilliant reefs. The latter, below the city, contained >40 t of gold, and was mined to 1.6 km down plunge, but did not outcrop.
The above summary was based largely on information provided by Citigold Corporation Limited in 2004. and updated from Towsey, C.A.J., 8 December 2020 - Mineral Resources and Ore Reserves 2020 Charters Towers Gold Project, a Technical Report prepared by Pathfinder Exploration of Geraldton, Western Australia for Citigold Corporation Limited, 189p.
The most recent source geological information used to prepare this decription was dated: 2020.
Record last updated: 1/2/2025
This description is a summary from published sources, the chief of which are listed below.
© Copyright Porter GeoConsultancy Pty Ltd. Unauthorised copying, reproduction, storage or dissemination prohibited.
Central Decline, Charters Towers
|
|
|
|
|
Kreuzer O P 2006 - Textures, paragenesis and wall-rock alteration of lode-gold deposits in the Charters Towers district, north Queensland: implications for the conditions of ore formation: in Mineralium Deposita v40 pp 639-663
|
Kreuzer O P, 2005 - Intrusion-Hosted Mineralization in the Charters Towers Goldfield, North Queensland: New Isotopic and Fluid Inclusion Constraints on the Timing and Origin of the Auriferous Veins: in Econ. Geol. v100 pp 1583-1603
|
Kreuzer O P, Blenkinsop T G, Morrison R J and Peters S G, 2007 - Ore controls in the Charters Towers goldfield, NE Australia: Constraints from geological, geophysical and numerical analyses: in Ore Geology Reviews v32 pp 37-80
|
|
Porter GeoConsultancy Pty Ltd (PorterGeo) provides access to this database at no charge. It is largely based on scientific papers and reports in the public domain, and was current when the sources consulted were published. While PorterGeo endeavour to ensure the information was accurate at the time of compilation and subsequent updating, PorterGeo, its employees and servants: i). do not warrant, or make any representation regarding the use, or results of the use of the information contained herein as to its correctness, accuracy, currency, or otherwise; and ii). expressly disclaim all liability or responsibility to any person using the information or conclusions contained herein.
|
Top | Search Again | PGC Home | Terms & Conditions
|
|